IBSI 2 Phase 3 Compliance: Reproducibility
Overview
IBSI 2 Phase 3 focuses on reproducibility across different software implementations. Unlike Phases 1 and 2, there are no consensus reference values. Instead, participant results are compared against each other to measure overlap.
This page documents Pictologics' agreement with 9 other teams on a multimodal (CT, MRI, PET) soft-tissue sarcoma dataset of 51 patients.
How to Run the Benchmarks
1. Download the Data
- IBSI 2 Phase 3 Data: Please refer to the IBSI GitHub repository for all data download instructions.
Organize the data as follows:
- data/ibsi2/data/validation/ct/*.nii.gz
- data/ibsi2/data/validation/pet/*.nii.gz
- data/ibsi2/data/validation/mri/*.nii.gz
- data/ibsi2/data/validation/masks/*.nii.gz
2. Run Validation Programmatically
from pictologics import RadiomicsPipeline

# Example: Run Mean filter (ID 2) on a specific patient/modality
image_path = "data/ibsi2/data/validation/ct/STS_001_image.nii.gz"
mask_path = "data/ibsi2/data/validation/masks/STS_001_CT_mask.nii.gz"

pipeline = RadiomicsPipeline()

# Define IBSI 2 Phase 3 CT Preprocessing
preprocess_steps = [
    {"step": "resample", "params": {
        "new_spacing": (1.0, 1.0, 1.0),
        "interpolation": "cubic",
        "mask_interpolation": "linear",
        "mask_threshold": 0.5
    }},
    {"step": "round_intensities", "params": {}},
    {"step": "resegment", "params": {"range_min": -200, "range_max": 200}}
]

# Add Mean Filter (ID 2) and Feature Extraction
config = preprocess_steps + [
    {"step": "filter", "params": {"type": "mean", "support": 3}},
    {"step": "extract_features", "params": {"families": ["intensity"]}}
]

pipeline.add_config("phase3_demo", config)
results = pipeline.run(image_path, mask_path, config_names=["phase3_demo"])
print(results["phase3_demo"])
Execution Time
Processing 153 scans (51 patients × 3 modalities) with multiple filters takes significant time (minutes to hours depending on CPU). The full validation suite is designed to run in parallel on multiple cores.
Phase 3 Results
Summary: Processed 153 scans (51 patients × 3 modalities), compared against 9 teams.
Tolerance Breakdown (% of Feature Range)
A value matches when its difference from the team's value is within 1, 5 or 10 % of the team's range for that modality, filter and feature (the maximum minus the minimum of the team's values over the 51 patients). Our value is first rounded to the team's number of decimals, as in the IBSI tolerance tests. A zero range needs an exact match.
| Team | Total Features | Within 1% | Within 5% | Within 10% | Status |
|---|---|---|---|---|---|
| CERR | 16524 | 14775 (89.4%) | 16109 (97.5%) | 16329 (98.8%) | ✅ 95%+ |
| Cardiff University | 24786 | 23091 (93.2%) | 24304 (98.1%) | 24505 (98.9%) | ✅ 95%+ |
| King's College London | 23868 | 22321 (93.5%) | 23516 (98.5%) | 23702 (99.3%) | ✅ 95%+ |
| NCT Dresden | 24786 | 24329 (98.2%) | 24575 (99.1%) | 24658 (99.5%) | ✅ 95%+ |
| Qurit SERA | 24751 | 19179 (77.5%) | 20834 (84.2%) | 21590 (87.2%) | 🟢 80-95% |
| UCSF | 24786 | 10096 (40.7%) | 10099 (40.7%) | 10103 (40.8%) | 🟠 40-60% |
| USZ | 16524 | 16395 (99.2%) | 16491 (99.8%) | 16512 (99.9%) | ✅ 95%+ |
| UdeS | 24786 | 20183 (81.4%) | 20324 (82.0%) | 20361 (82.1%) | 🟢 80-95% |
| Veneto Institute of Oncology | 24786 | 19622 (79.2%) | 21277 (85.8%) | 22285 (89.9%) | 🟢 80-95% |
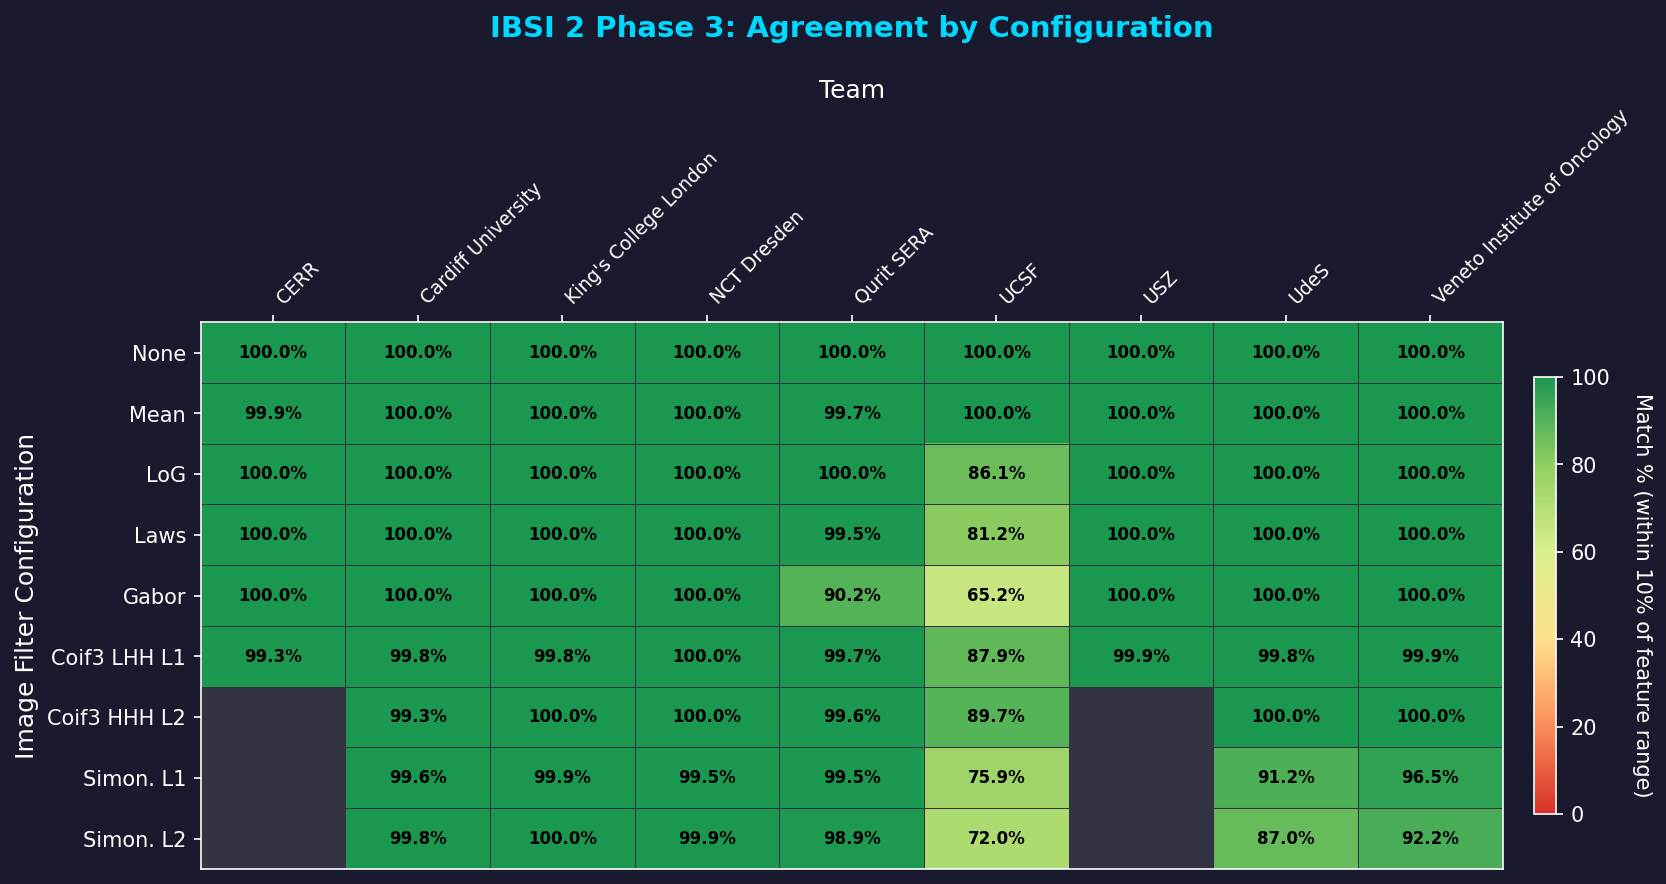
Agreement by Configuration
The heatmap below shows the percentage of values within 10 % of the team's range (for the modality, filter and feature) for each configuration/team combination. Point at a cell for its values.
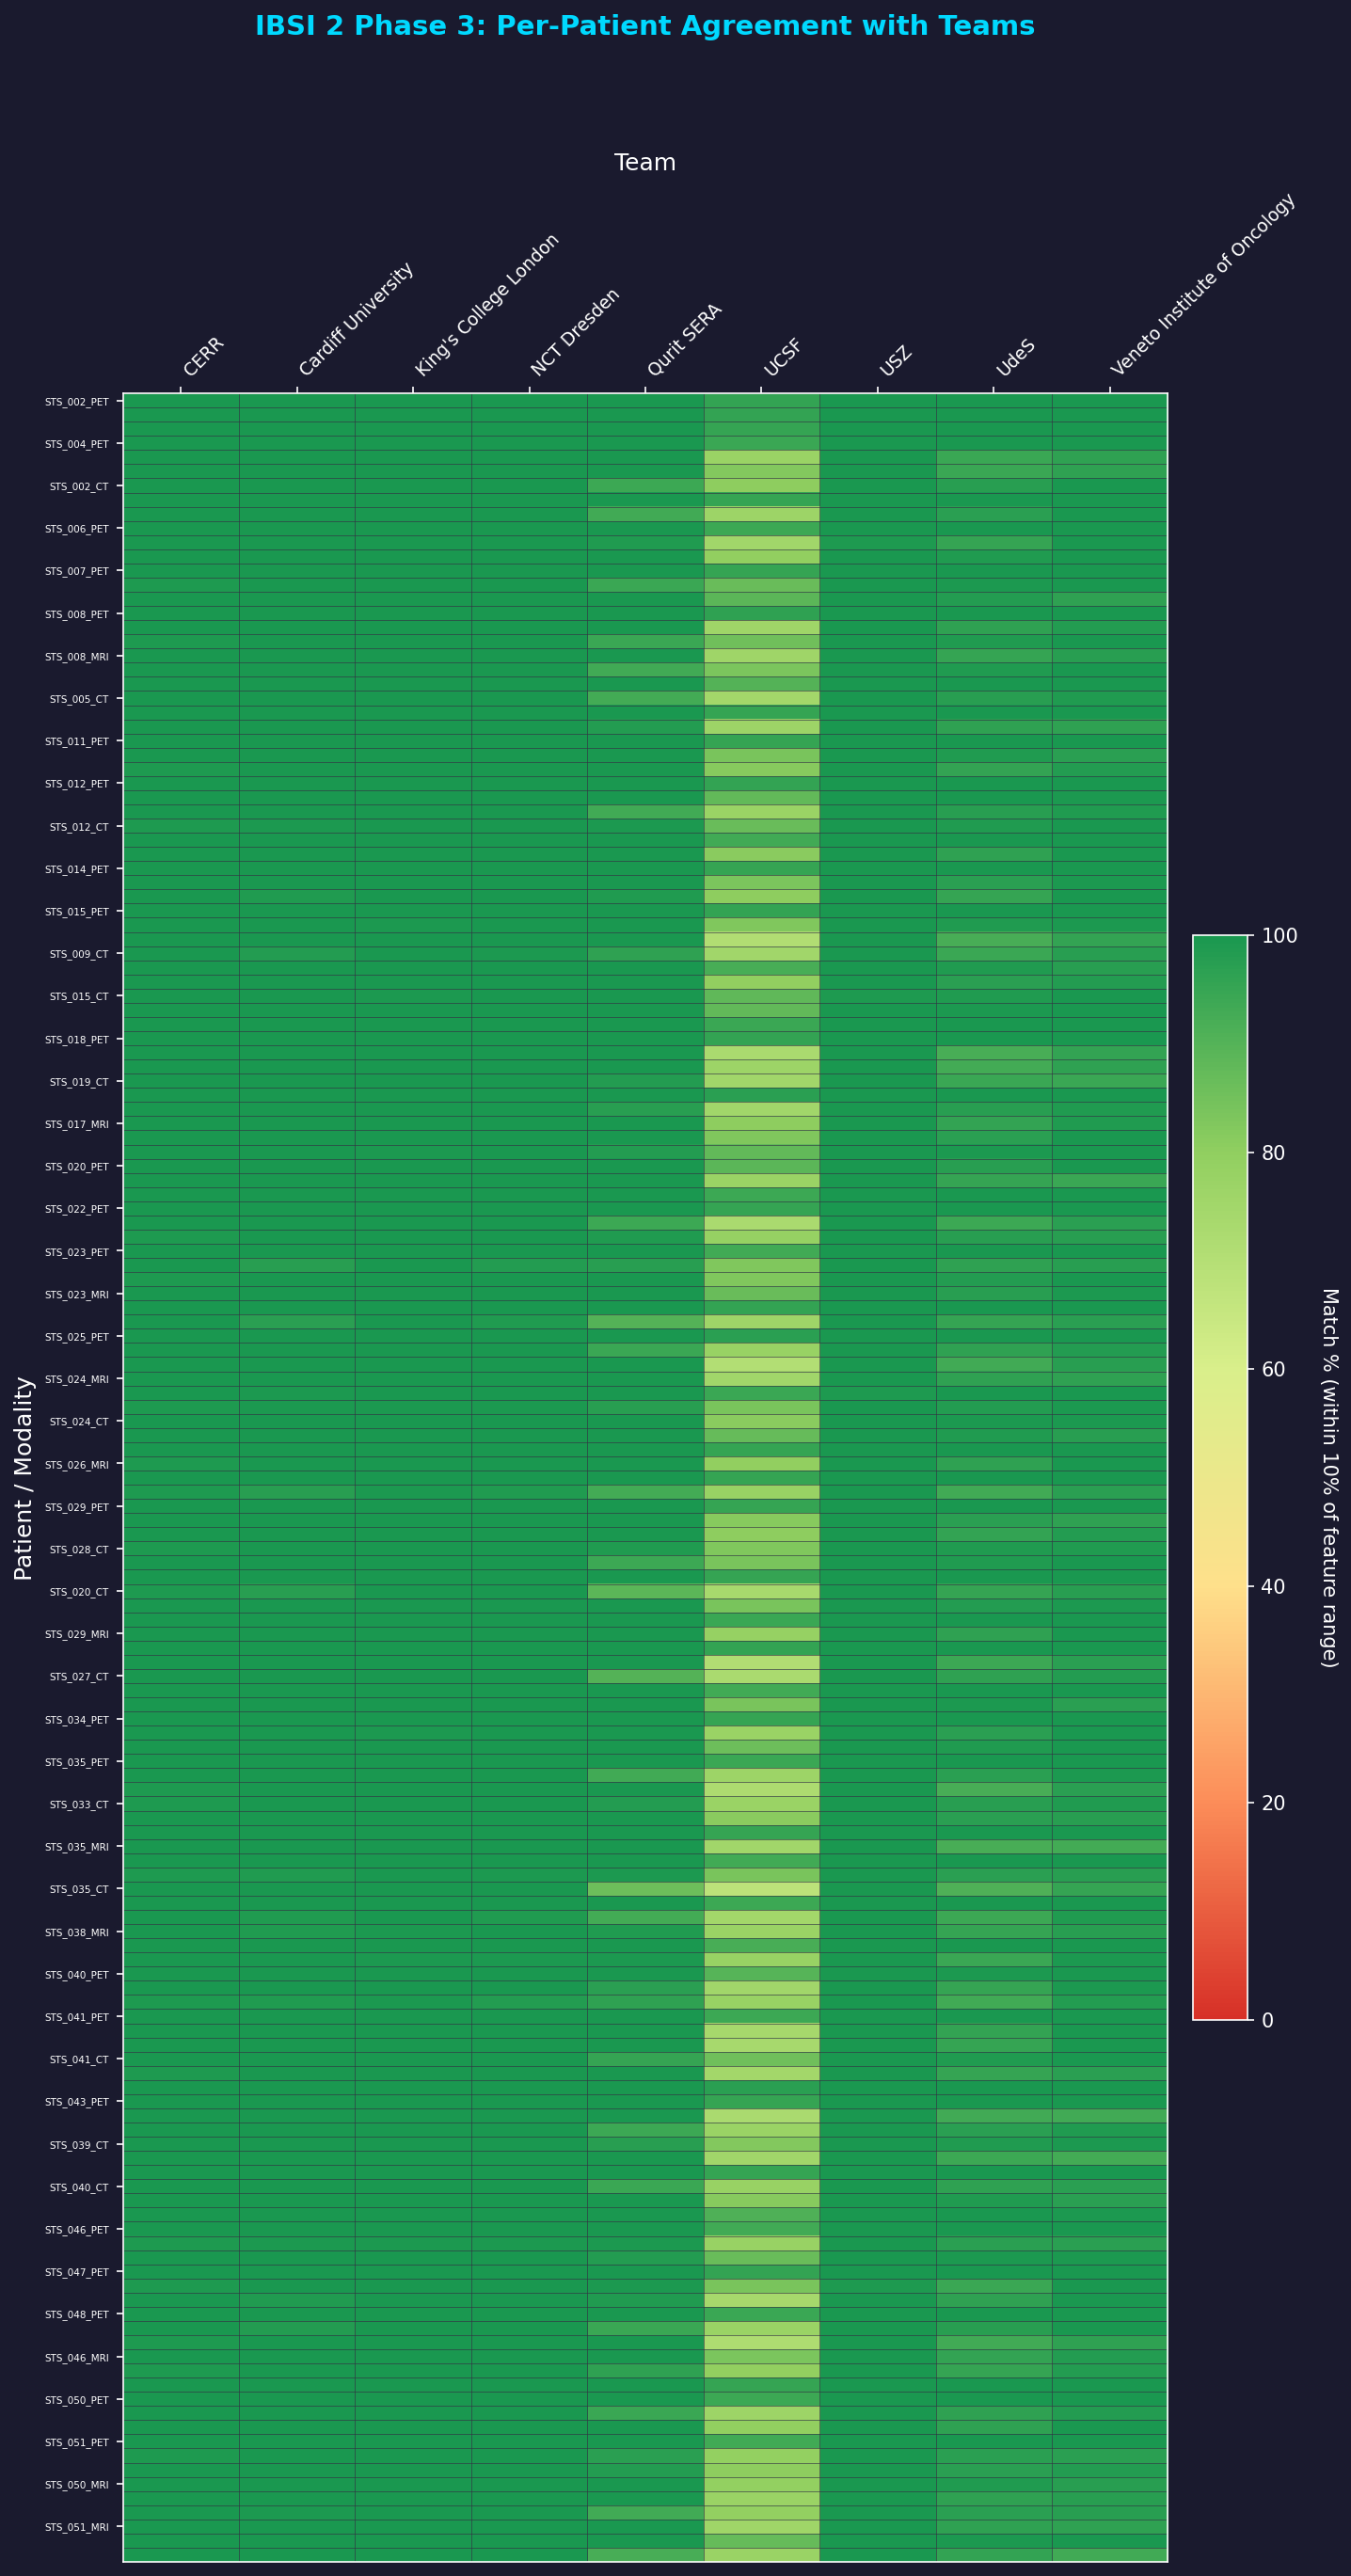
Per-Patient Agreement
The heatmap below shows per-patient agreement with each team across all filter configurations. Point at a cell for the scan and its values.
Mismatch Details
Mismatches shown below are cases where the error exceeds 10% of the team's range for the modality, filter and feature.
Configuration Legend
| Short Name | Full Description |
|---|---|
| None | No filter (baseline) |
| Mean | Mean filter (3×3×3 kernel) |
| LoG | Laplacian of Gaussian (σ=3mm) |
| Laws | Laws S5E5L5 texture filter |
| Gabor | Gabor filter (2D, θ=-5π/8) |
| Coif3 LHH L1 | Coiflet 3 wavelet, LHH decomposition, level 1 |
| Coif3 HHH L2 | Coiflet 3 wavelet, HHH decomposition, level 2 |
| Simon. L1 | Simoncelli steerable pyramid, level 1 (periodic boundary, see below) |
| Simon. L2 | Simoncelli steerable pyramid, level 2 (periodic boundary, see below) |
Simoncelli Boundary
The IBSI 2 manual's phase 3 table lists the mirror boundary for all filters. For the Simoncelli filters (IDs 8 and 9), Pictologics uses the periodic boundary of its FFT filters, as in IBSI 2 phases 1 and 2, because it gives the better match: over all teams, 58.1 % of the Simoncelli values are within 1 % of the team's range with the periodic boundary and 56.0 % with the mirror boundary; the periodic boundary matches 4 of the 7 teams at least as well. Share of values within 1 % of the range:
| Team | Periodic (used) | Mirror |
|---|---|---|
| Cardiff University | 79.9% | 82.4% |
| King's College London | 93.0% | 83.5% |
| NCT Dresden | 94.2% | 89.9% |
| Qurit SERA | 86.1% | 81.9% |
| UCSF | 20.7% | 21.2% |
| UdeS | 20.7% | 21.2% |
| Veneto Institute of Oncology | 12.2% | 12.0% |
CERR
195 of 16524 values differ by more than 10 % of the range. The 10 largest, relative to the range:
| Patient | Feature | Configuration | Pictologics Value | Team Value | Error | Range |
|---|---|---|---|---|---|---|
| STS_048_CT | stat_cov | LoG | -7493 | 196.1 | 7690 | 332.3 |
| STS_049_MRI | stat_qcod | LoG | 1749 | 13.98 | 1735 | 105.6 |
| STS_021_MRI | stat_cov | LoG | -1097 | 79.72 | 1176 | 122.7 |
| STS_045_MRI | stat_cov | LoG | -643.5 | -43.01 | 600.5 | 122.7 |
| STS_050_CT | stat_qcod | Coif3 LHH L1 | -1.388e+05 | 1799 | 1.406e+05 | 2.958e+04 |
| STS_045_PET | stat_qcod | LoG | -259.9 | -35.09 | 224.8 | 51.05 |
| STS_020_PET | stat_cov | LoG | -1320 | -302.7 | 1017 | 308.1 |
| STS_050_MRI | stat_cov | LoG | -181.1 | 30.95 | 212.1 | 122.7 |
| STS_003_CT | stat_median | Coif3 LHH L1 | -0.02632 | 0.001908 | 0.02823 | 0.01912 |
| STS_012_CT | stat_cov | Coif3 LHH L1 | -3.282e+05 | 6075 | 3.343e+05 | 2.325e+05 |
Cardiff University
281 of 24786 values differ by more than 10 % of the range. The 10 largest, relative to the range:
| Patient | Feature | Configuration | Pictologics Value | Team Value | Error | Range |
|---|---|---|---|---|---|---|
| STS_049_MRI | stat_qcod | LoG | 1749 | 13.98 | 1735 | 98.73 |
| STS_048_CT | stat_cov | LoG | -7493 | 196.1 | 7690 | 544.8 |
| STS_021_MRI | stat_cov | LoG | -1097 | 27.56 | 1124 | 109.7 |
| STS_045_MRI | stat_cov | LoG | -643.5 | 82.86 | 726.3 | 109.7 |
| STS_050_CT | stat_qcod | Coif3 LHH L1 | -1.388e+05 | -1.726e+04 | 1.216e+05 | 2.741e+04 |
| STS_014_CT | stat_qcod | LoG | -1188 | 46.59 | 1234 | 293.1 |
| STS_021_CT | stat_qcod | Simon. L1 | 1.344e+05 | -5.431e+04 | 1.887e+05 | 5.585e+04 |
| STS_021_CT | stat_cov | Simon. L2 | 7190 | -2915 | 1.01e+04 | 3363 |
| STS_021_PET | stat_qcod | Simon. L2 | -584.6 | 114.2 | 698.8 | 264 |
| STS_038_CT | stat_qcod | Simon. L1 | 1.217e+05 | -227.3 | 1.219e+05 | 5.585e+04 |
King's College London
166 of 23868 values differ by more than 10 % of the range. The 10 largest, relative to the range:
| Patient | Feature | Configuration | Pictologics Value | Team Value | Error | Range |
|---|---|---|---|---|---|---|
| STS_049_MRI | stat_qcod | LoG | 1749 | 13.98 | 1735 | 108.8 |
| STS_048_CT | stat_cov | LoG | -7493 | 196.1 | 7690 | 568.5 |
| STS_021_MRI | stat_cov | LoG | -1097 | 27.56 | 1124 | 102.5 |
| STS_050_CT | stat_qcod | Coif3 LHH L1 | -1.388e+05 | -469.6 | 1.384e+05 | 1.482e+04 |
| STS_021_CT | stat_qcod | Simon. L1 | 1.344e+05 | -1.688e+04 | 1.513e+05 | 1.982e+04 |
| STS_045_MRI | stat_cov | LoG | -643.5 | 75.6 | 719.1 | 102.5 |
| STS_038_CT | stat_qcod | Simon. L1 | 1.217e+05 | 2942 | 1.187e+05 | 1.982e+04 |
| STS_014_CT | stat_qcod | LoG | -1188 | 46.72 | 1235 | 218.2 |
| STS_050_MRI | stat_cov | LoG | -181.1 | 33.91 | 215 | 102.5 |
| STS_021_PET | stat_qcod | Simon. L2 | -584.6 | -220.6 | 364 | 253.3 |
NCT Dresden
128 of 24786 values differ by more than 10 % of the range. The 10 largest, relative to the range:
| Patient | Feature | Configuration | Pictologics Value | Team Value | Error | Range |
|---|---|---|---|---|---|---|
| STS_050_CT | stat_qcod | Coif3 LHH L1 | -1.388e+05 | 3.161e+04 | 1.704e+05 | 4.269e+04 |
| STS_045_PET | stat_qcod | LoG | -259.9 | -71.78 | 188.1 | 88.52 |
| STS_038_CT | stat_qcod | Simon. L1 | 1.217e+05 | -225 | 1.219e+05 | 8.212e+04 |
| STS_034_CT | stat_max | Simon. L1 | 329.1 | 112 | 217.1 | 180.5 |
| STS_026_CT | stat_max | Simon. L1 | 304.1 | 95.66 | 208.4 | 180.5 |
| STS_022_MRI | stat_kurt | Simon. L1 | 55.15 | 20.64 | 34.51 | 32.9 |
| STS_022_CT | stat_max | Simon. L1 | 307.5 | 118.8 | 188.7 | 180.5 |
| STS_022_MRI | stat_skew | Simon. L1 | -1.804 | 2.289 | 4.093 | 3.971 |
| STS_036_MRI | stat_cov | Simon. L1 | -1.632e+04 | 8.126e+05 | 8.289e+05 | 8.145e+05 |
| STS_038_CT | stat_max | Simon. L1 | 300.9 | 120.1 | 180.8 | 180.5 |
Qurit SERA
3161 of 24751 values differ by more than 10 % of the range. The 10 largest, relative to the range:
| Patient | Feature | Configuration | Pictologics Value | Team Value | Error | Range |
|---|---|---|---|---|---|---|
| STS_027_CT | stat_max | Gabor | 2149 | 200 | 1949 | 1 |
| STS_027_CT | stat_range | Gabor | 2149 | 200 | 1949 | 1 |
| STS_035_CT | stat_max | Gabor | 1817 | 200 | 1617 | 1 |
| STS_037_CT | stat_max | Gabor | 1427 | 200 | 1227 | 1 |
| STS_034_CT | stat_max | Gabor | 1375 | 200 | 1175 | 1 |
| STS_034_CT | stat_range | Gabor | 1375 | 200 | 1175 | 1 |
| STS_022_CT | stat_max | Gabor | 1313 | 200 | 1113 | 1 |
| STS_029_CT | stat_max | Gabor | 1036 | 200 | 836.5 | 1 |
| STS_029_CT | stat_range | Gabor | 1036 | 200 | 836 | 1 |
| STS_001_CT | stat_max | Gabor | 863.4 | 200 | 663.4 | 1 |
UCSF
14683 of 24786 values differ by more than 10 % of the range. The 10 largest, relative to the range:
| Patient | Feature | Configuration | Pictologics Value | Team Value | Error | Range |
|---|---|---|---|---|---|---|
| STS_001_CT | stat_mean | Laws | 52 | 0 | 52 | 0 |
| STS_001_CT | stat_mean | Gabor | 170 | 0 | 170 | 0 |
| STS_001_CT | stat_mean | Coif3 HHH L2 | 16 | 0 | 16 | 0 |
| STS_001_CT | stat_var | Laws | 99 | 0 | 99 | 0 |
| STS_001_CT | stat_var | Gabor | 1.245e+04 | 0 | 1.245e+04 | 0 |
| STS_001_CT | stat_var | Coif3 LHH L1 | 1 | 0 | 1 | 0 |
| STS_001_CT | stat_var | Coif3 HHH L2 | 96 | 0 | 96 | 0 |
| STS_001_CT | stat_var | Simon. L1 | 250 | 0 | 250 | 0 |
| STS_001_CT | stat_var | Simon. L2 | 76 | 0 | 76 | 0 |
| STS_001_CT | stat_skew | Gabor | 1 | 0 | 1 | 0 |
USZ
12 of 16524 values differ by more than 10 % of the range. The 10 largest, relative to the range:
| Patient | Feature | Configuration | Pictologics Value | Team Value | Error | Range |
|---|---|---|---|---|---|---|
| STS_050_CT | stat_qcod | Coif3 LHH L1 | -1.388e+05 | 3.177e+04 | 1.706e+05 | 4.27e+04 |
| STS_026_PET | stat_qcod | Coif3 LHH L1 | -3157 | -194.8 | 2962 | 2344 |
| STS_045_PET | stat_qcod | Coif3 LHH L1 | 1584 | -688.7 | 2273 | 2344 |
| STS_021_MRI | stat_cov | LoG | -1097 | -592.1 | 504.6 | 721.1 |
| STS_041_PET | stat_qcod | Coif3 LHH L1 | -336 | -1338 | 1002 | 2344 |
| STS_015_CT | stat_cov | Coif3 LHH L1 | 1.458e+04 | 1.602e+05 | 1.456e+05 | 4.884e+05 |
| STS_044_MRI | stat_min | Mean | 216 | 150.2 | 65.8 | 258.2 |
| STS_034_MRI | stat_min | Mean | 194.1 | 136 | 58.1 | 258.2 |
| STS_026_MRI | stat_min | Mean | 163.9 | 129.1 | 34.75 | 258.2 |
| STS_045_PET | stat_kurt | Gabor | 16.95 | 13.44 | 3.507 | 26.17 |
UdeS
4425 of 24786 values differ by more than 10 % of the range. The 10 largest, relative to the range:
| Patient | Feature | Configuration | Pictologics Value | Team Value | Error | Range |
|---|---|---|---|---|---|---|
| STS_001_CT | stat_var | Simon. L1 | 250 | 0 | 250 | 0 |
| STS_001_CT | stat_var | Simon. L2 | 76 | 0 | 76 | 0 |
| STS_001_CT | stat_min | Simon. L1 | -79 | 0 | 79 | 0 |
| STS_001_CT | stat_min | Simon. L2 | -38 | 0 | 38 | 0 |
| STS_001_CT | stat_p10 | Simon. L1 | -20 | 0 | 20 | 0 |
| STS_001_CT | stat_p10 | Simon. L2 | -11 | 0 | 11 | 0 |
| STS_001_CT | stat_p90 | Simon. L1 | 20 | 0 | 20 | 0 |
| STS_001_CT | stat_p90 | Simon. L2 | 11 | 0 | 11 | 0 |
| STS_001_CT | stat_max | Simon. L1 | 78 | 0 | 78 | 0 |
| STS_001_CT | stat_max | Simon. L2 | 43 | 0 | 43 | 0 |
Veneto Institute of Oncology
2501 of 24786 values differ by more than 10 % of the range. The 10 largest, relative to the range:
| Patient | Feature | Configuration | Pictologics Value | Team Value | Error | Range |
|---|---|---|---|---|---|---|
| STS_036_MRI | stat_cov | Simon. L1 | -1.632e+04 | -39.6 | 1.628e+04 | 558.5 |
| STS_001_CT | stat_qcod | Simon. L2 | 2018 | -15.17 | 2033 | 73.8 |
| STS_046_CT | stat_qcod | Simon. L2 | -1328 | 4.325 | 1332 | 73.8 |
| STS_049_MRI | stat_qcod | LoG | 1749 | 13.98 | 1735 | 110 |
| STS_048_CT | stat_cov | LoG | -7493 | 196.1 | 7690 | 573.5 |
| STS_021_MRI | stat_cov | LoG | -1097 | 27.56 | 1124 | 102.5 |
| STS_007_CT | stat_qcod | Simon. L2 | -799.8 | -8.832 | 791 | 73.8 |
| STS_009_CT | stat_qcod | Simon. L2 | 689.8 | 23.41 | 666.4 | 73.8 |
| STS_021_PET | stat_qcod | Simon. L2 | -584.6 | 3.754 | 588.4 | 73.92 |
| STS_021_CT | stat_qcod | Simon. L2 | 519.4 | -20.5 | 539.9 | 73.8 |